Search Visibility Metrics: What to Track and How to Read Them

Search visibility metrics tell you how often and how prominently your site shows up when customers search. The useful set is small: a visibility score from a rank-tracking tool for a fixed keyword list, plus impressions, clicks, average position and click-through rate from Google Search Console, read against leads and revenue. We build SEO engagements around that combination, because a single number on its own can mislead.
TL;DR
- Search visibility is the estimated share of clicks your site earns from its organic rankings for a set of keywords. It is a modeled estimate, not a count.
- Google Search Console gives observed data (impressions, clicks, average position, CTR). A visibility score from a tool gives a modeled view of a keyword list you choose.
- Scores differ between tools because each uses its own click curve, keyword set and scale. Compare trends inside one tool, never across tools.
- A “good” percentage depends on the keyword list. Improvement over time, tied to leads and revenue, matters more than the exact figure.
- Local businesses, ecommerce stores and SaaS companies should each track a different keyword set, and local firms should also watch Google Business Profile.
Table of Contents
- What search visibility metrics actually measure
- How a visibility score is calculated
- What is a good search visibility percentage?
- Search Console versus a visibility score
- Reading the numbers: three situations
- Turning visibility data into action
- How to track visibility by business type
- Where our team fits
- FAQ
What search visibility metrics actually measure
Search visibility is the estimated percentage of clicks a website gets from its organic rankings for one or more keywords. Ahrefs gives a simple example: if a keyword is searched 100 times and your site gets 5 clicks, your visibility for that keyword is 5%.
That makes it different from the other numbers you see:
- Rankings tell you where one page sits for one query.
- Impressions count how many times your site appeared in results.
- Clicks count how many times someone clicked through.
- Organic traffic counts visits that arrived, from analytics.
- Visibility combines rank, search volume and expected click rate across many keywords into one trend line.
Google’s own Search Console help page defines four of these: impressions, clicks, average position and the query that triggered the result. Those are observed data. A visibility score is built on top of them, or on top of a tool’s own rank checks, and is an estimate.
Why bother with a blended number? Search Engine Land’s guide argues that AI Overviews, map packs and other results features make single-keyword positions a weaker picture than overall presence on the results page. A page can hold position 3 and still lose clicks because something sits above it.
How a visibility score is calculated
Every tool follows the same basic logic: take the rank of each tracked keyword, apply an expected click-through rate for that position, weight by search volume, add it up, and compare it with the maximum possible if you ranked first for everything. SEO Analyser publishes the formula as the sum of volume times CTR at your position, divided by the sum of volume times CTR at position 1, times 100.
The details differ by tool:
| Approach | What the score means | Scale |
|---|---|---|
| CTR-weighted percentage | Semrush’s Visibility % uses progress in the top 100 for tracked keywords; 100% means first place for every one | 0 to 100% |
| Share of clicks | Ahrefs shows the share of all clicks for tracked keywords that land on your site | Percentage |
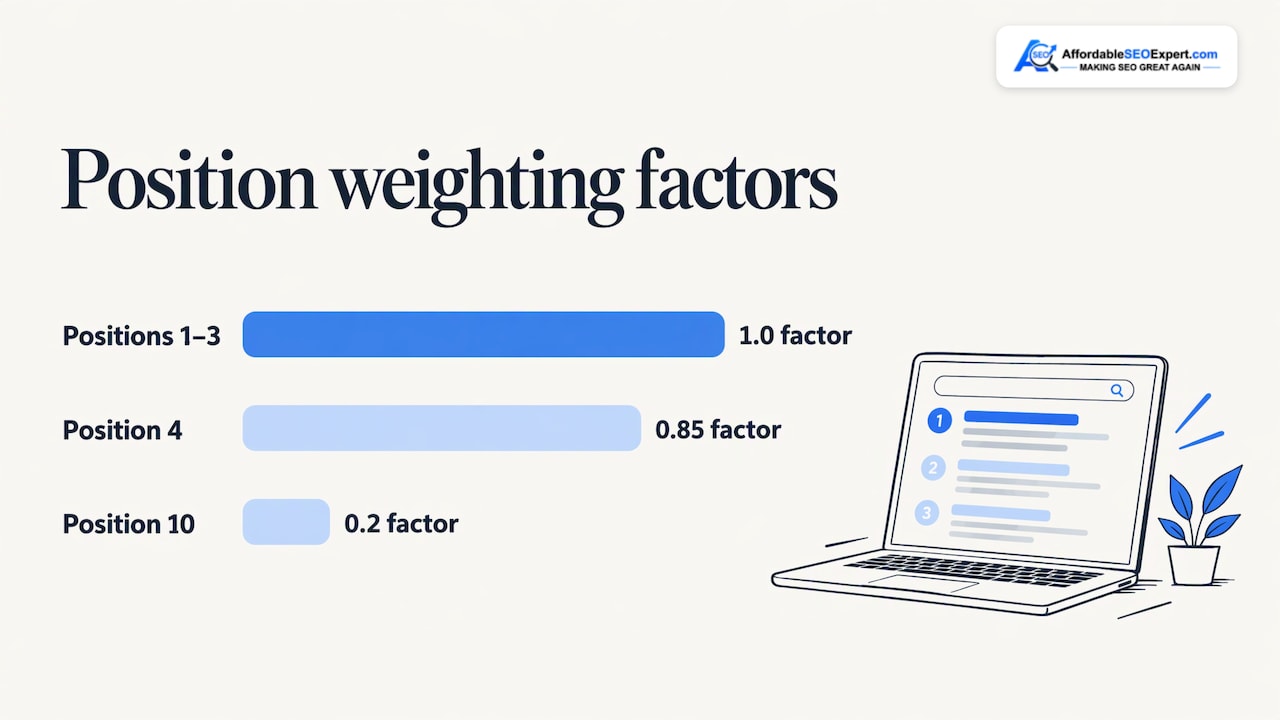
| Volume times position factor | SE Ranking’s formula multiplies search volume by a factor: 1.0 for positions 1 to 3, 0.85 for 4th, 0.2 for 10th, 0 below 10th | Absolute number |
SE Ranking’s own example: 4th place on a keyword searched 1,000 times scores 850.
The weakest input is the click curve. A fixed average cannot know whether a query shows a local pack, an AI answer or a featured snippet, or whether it is a brand search, as SEO Analyser notes. That is one reason two tools report different scores for the same site. If you have ever wondered why rankings don’t match across platforms, our breakdown of Semrush versus Ahrefs ranking differences covers it.
The practical rule: pick one tool, report the score with that tool’s name, and compare it only with its own earlier readings.
What is a good search visibility percentage?
There is no universal answer. Published benchmarks vary widely. Search Engine Land says roughly 50% is good and above that is excellent. Other guides put healthy programs much lower: LLMrefs describes 1 to 5% as visible only in pockets, 6 to 15% as some page-one traction, and 16 to 30% as where many healthy programs start to scale.
Both can be right, because the score depends on what you track. Forty percent across fifty easy, low-volume keywords is worth less than 25% across the competitive terms that bring buyers. Two things distort the number most:
- Branded keywords. Tracking your own company name inflates the score, since you will rank first for it.
- Keyword list changes. Adding or removing keywords moves the score without any change in your SEO.
So build the list deliberately: the terms that bring customers, with branded terms kept separate. Then watch the direction. Improvement matters more than the exact percentage.
Search Console versus a visibility score
Use both, for different jobs.
Google Search Console is free and shows observed data across every query your site appears for: clicks, impressions, average CTR and average position. Google suggests verifying ownership, fixing indexing errors and monitoring performance by query, page and country. If you serve only the U.S., filter by country, as Search Engine Land’s analytics guide advises.
A tool-based visibility score covers the controlled list you choose, includes competitors in the same view and tracks positions daily or weekly.
A simple baseline looks like this:
- Load your target keywords into one rank-tracking tool and record the score.
- Pull impressions, clicks and average position from Search Console for the same date range.
- Add leads, calls or sales from your analytics and CRM.
- Repeat monthly and compare to the same month last year if you have it.
Google also publishes a method for combining Search Console and Analytics data using clicks, CTR, sessions, engagement rate and returning users, with traffic filtered to Google organic.
Reading the numbers: three situations
Impressions up, clicks flat. You are showing for more queries but not earning the click. Titles and descriptions may not match intent, or results features are absorbing clicks. Google’s traffic-drop guide points to snippet appeal when impressions hold but clicks fall. If you suspect results-page features, read how to optimize for zero-click searches.
Impressions and clicks both down. Check the common causes: indexing problems, lost pages, a site change or an algorithm update. Use the Performance report with the last 16 months selected so a seasonal dip is not mistaken for a loss. Our piece on how a core update disrupted SEO tracking shows why one chart is not enough.
Visibility down, leads steady. Search Engine Land’s analytics guide says metrics like impressions, clicks and rankings are diagnostic signals rather than the goal. If conversions hold, there is rarely reason to panic. Check by segment, history and competitors before reacting.
The reverse also happens. A high score does not prove SEO produces revenue, since it says nothing about whether landing pages convert or whether branded demand is inflating the picture. Pair it with traffic, conversions and revenue. For that last step, see how to measure SEO ROI honestly.
Turning visibility data into action
A monthly routine, adapted from Search Engine Watch’s workflow, keeps this manageable:
- List the five pages with the biggest click losses.
- Compare your peak month with the latest to see which queries dropped.
- Find queries ranking at positions 8 to 20. These are close to page one and the quickest wins.
- Rewrite titles and meta descriptions on pages with high impressions and low CTR.
- Confirm the pages are indexed before and after edits.
- Re-measure clicks four to six weeks later.
Use weekly or monthly views rather than daily ones, since Google recommends them to smooth day-of-week swings.
The hard part is not the routine. It is deciding which losses are worth fixing, which keywords belong in the tracked set, and whether the cause is content, technical health or links. That judgment is what our SEO consulting and monthly service is built around: testing what moves rankings for your site rather than applying a template.
How to track visibility by business type
Local service businesses and professionals
Dentists, lawyers, HVAC companies, roofers and similar firms compete in local results, where proximity matters. Search Engine Land warns that keyword tools may misreport volumes in small towns, and recommends watching local impressions and queries in Search Console and Google Business Profile Insights for calls, directions and website clicks.
Yext Research found that 3 to 7 diverse keywords per location, covering distinct search topics rather than synonyms, balance information against cost. Seed them from your primary Google Business Profile category. A med spa might track “massage near me,” “facial” and “day spa” rather than three versions of the same phrase.
If you want this handled, our local SEO service covers Google Business Profile and local optimization, and plans for local and small business SEO start from $999 per month.
Ecommerce
Track category and product-group keywords separately from brand terms, and tie visibility changes to revenue per organic session rather than traffic alone. Our ecommerce SEO service works from search intent for category and product pages.
SaaS
Split the tracked list into problem-aware, comparison and brand keywords. Visibility on comparison and problem terms is usually the earliest sign of pipeline growth. National SEO for ecommerce, SaaS and other sites starts from $1,699 per month.
Visibility in AI answers
Classic visibility scores measure the blue-link results. If AI answers matter in your market, add them as a separate line instead of blending them in. Our AI SEO services cover entity optimization and AI search visibility.
Where our team fits
Tracking visibility is easy to start and easy to get wrong: a keyword list padded with brand terms, a tool score reported without its name, a dip read as a disaster. We pair visibility data with conversions, so decisions follow revenue. Our SEO plans start at $999 per month for local and small business SEO and $1,699 per month for national, ecommerce and SaaS SEO. See how we work and what is included.
If links are the gap, our link building services add authority to the pages you want to rank.
FAQ
How do you measure search visibility?
Choose one rank-tracking tool and a fixed list of non-branded keywords that matter to your business. Record the visibility score, then pull impressions, clicks and average position from Google Search Console for the same dates. Repeat monthly and compare trends.
What is a good search visibility percentage?
It depends on your keyword list and sector. Some guides call about 50% good, while others treat 16 to 30% as healthy growth. Judge the direction over time and whether leads follow, not a single figure.
Why does my visibility score differ between tools?
Each tool uses its own keyword data, click curve and scale. Some report a percentage, others an absolute index. Compare trends within one tool, and label every reported score with the tool that produced it.
Is search visibility the same as organic traffic?
No. Visibility is an estimate of potential click share for tracked keywords. Organic traffic is the actual visits recorded in analytics. They usually move together, but visibility can rise before traffic does, and traffic can include branded visits that visibility excludes.
Why did my search visibility drop?
Common causes are lost rankings, indexing problems, an algorithm update, a changed keyword list or seasonal demand. View 16 months of Search Console data first, then segment by page and query. If leads are steady, the dip may not need action.